In the digital age, information is everywhere, but understanding data quickly is often challenging. Long tables and spreadsheets can make it difficult to identify patterns or proportions. A pie chart maker solves this problem by turning numerical information into a clear visual format. It allows users to present data in a circular chart where each segment represents a portion of the whole.
A pie chart maker is commonly used by professionals, educators, researchers, and business analysts who need a quick and effective way to explain statistics. Instead of describing numbers in paragraphs, users can present information visually so that audiences can understand it within seconds.
Contents
What a Pie Chart Maker Does
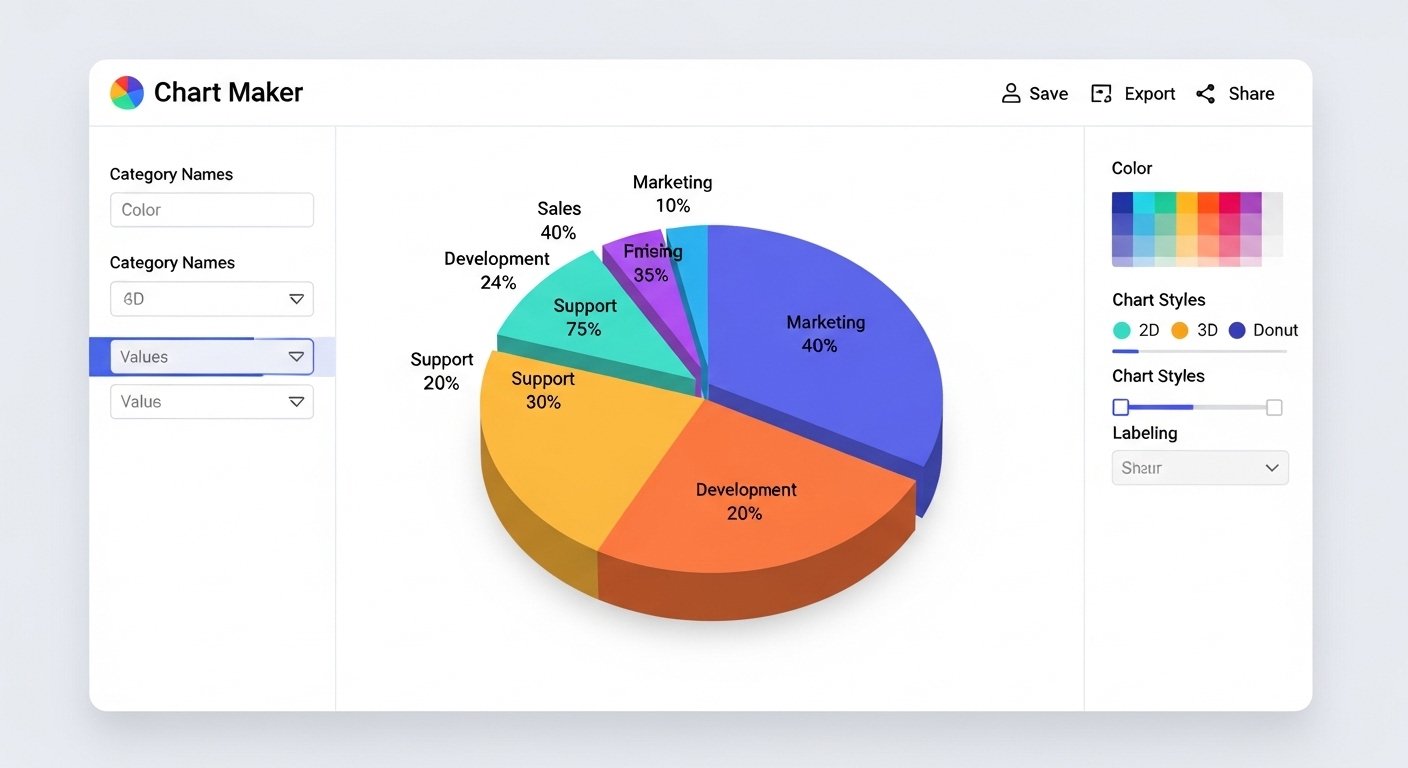
A pie chart maker is a digital tool designed to create pie charts automatically from data inputs. Users simply enter values or percentages, and the tool generates a chart that divides the circle into segments based on those numbers.
Each slice of the chart represents a category, while the size of the slice reflects its proportion compared to the total. This simple design helps viewers immediately recognize how different parts contribute to the whole dataset.
Modern pie chart makers also allow customization. Users can adjust colors, labels, fonts, and legends to make the chart more professional and suitable for reports or presentations.
How Pie Chart Makers Improve Data Presentation
One of the main reasons people use a pie chart maker is to simplify communication. Visual content is easier to understand than blocks of numbers. When information is displayed through a pie chart, viewers can instantly see which category dominates and which categories are smaller.
For example, a company might use a pie chart to show how its revenue is distributed among different products. With a quick glance, decision-makers can identify which product generates the highest income.
Because of this advantage, pie charts are frequently used in business meetings, academic presentations, research papers, and marketing reports.
Key Advantages of Using a Pie Chart Maker
A professional pie chart maker offers several practical benefits. The first advantage is speed. Instead of manually calculating proportions and designing charts, users can generate a complete chart within seconds.
Another benefit is accuracy. The software automatically calculates percentages and ensures that the chart reflects the data correctly. This reduces the risk of calculation errors.
A pie chart maker also improves presentation quality. Well-designed charts look professional and help make reports more engaging. Visual elements capture attention and make complex data easier to understand.
Common Uses of Pie Chart Makers
The flexibility of a pie chart maker makes it useful in many fields. Businesses often use pie charts to show market share, sales distribution, or budget allocation. These charts help managers make strategic decisions based on clear visual insights.
In education, teachers and students use pie charts when presenting research findings or survey results. The visual format helps audiences quickly understand statistical comparisons.
Marketing professionals also rely on pie charts to analyze customer behavior, audience demographics, and campaign performance.
Conclusion
A pie chart maker is a valuable tool for anyone who needs to present data clearly and professionally. By transforming numbers into visual segments, it allows audiences to quickly understand proportions and relationships within a dataset. In business, education, and research, pie charts continue to play an important role in making information more accessible and easier to interpret.